


Dashboard
The dashboard in RETM serves as your control center, offering a comprehensive overview of your store's performance through a set of essential data and statistics. You can monitor revenues, invoices, customers, discounts, and the average invoice value, in addition to detailed analyses of top-selling items, revenue by category, and payment methods. This information assists you in making informed decisions and enhancing your sales management.RETM
Steps to Access the Dashboard in RETM
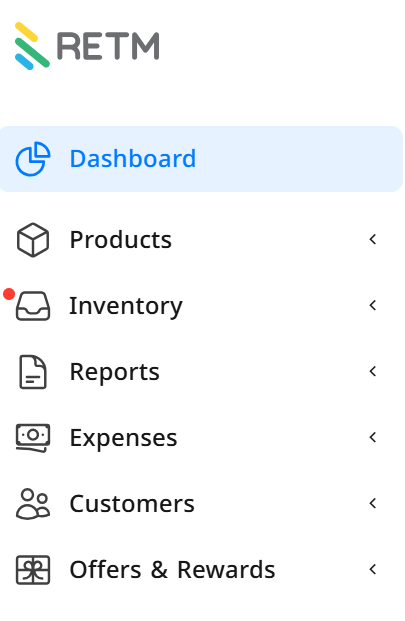
- From the sidebar menu, click on the dashboard to view your store's statistics.
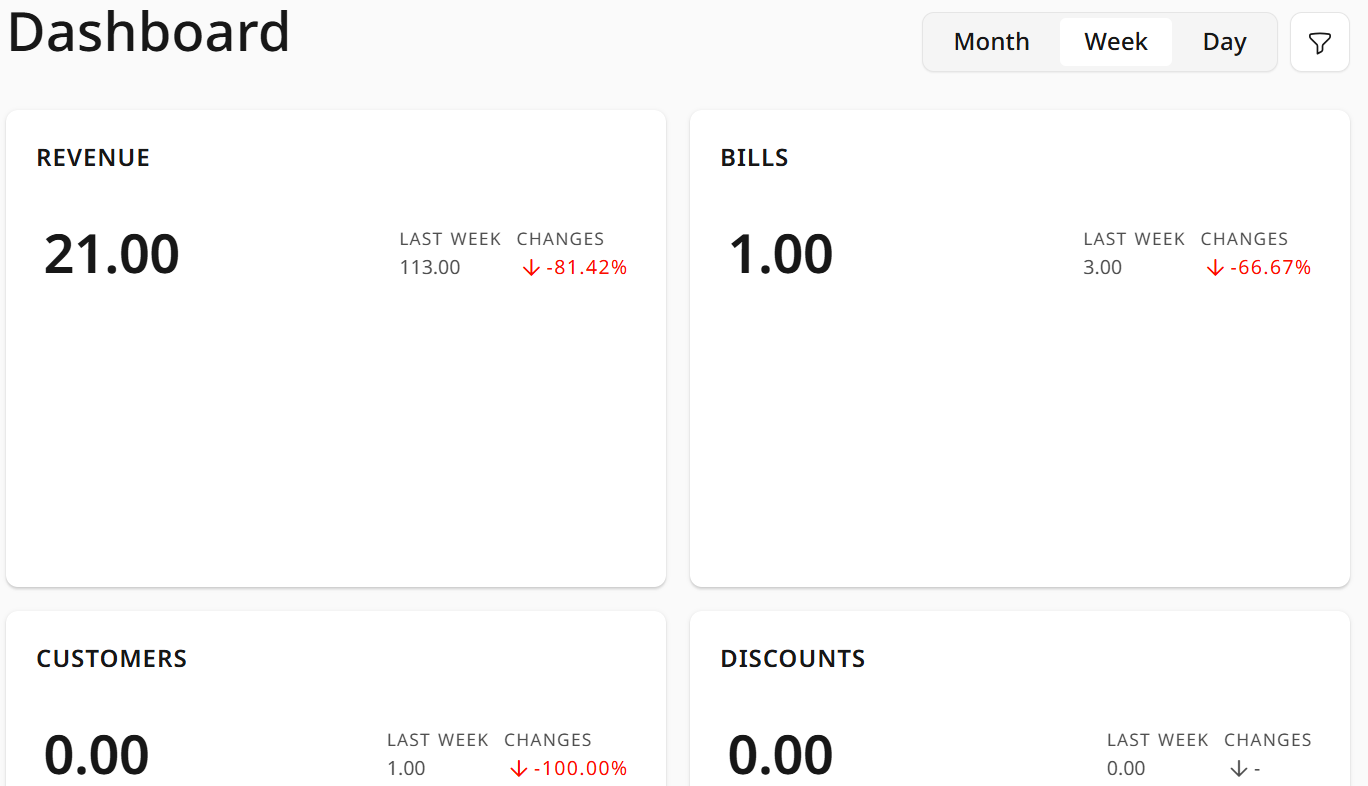
- You can filter the displayed data to select the appropriate time period by clicking on one of the following options: (Daily, Weekly, Monthly).
- Once the time period is selected, information and reports for the following sections will appear, such as revenues, invoices, and customers.
How to Use the Dashboard
1. Data Filtering:
You can choose the time period you wish to analyze using the available filters, allowing you to display data by:
- Day: To view revenues and transactions that occurred during the current day.
- Week: To analyze sales performance during the current week.
- Month: To get a comprehensive summary of revenues and transactions during the current month.
2. Viewing Statistics and Reports:
Once the time period is selected, a set of detailed data about the store's performance will appear, including:
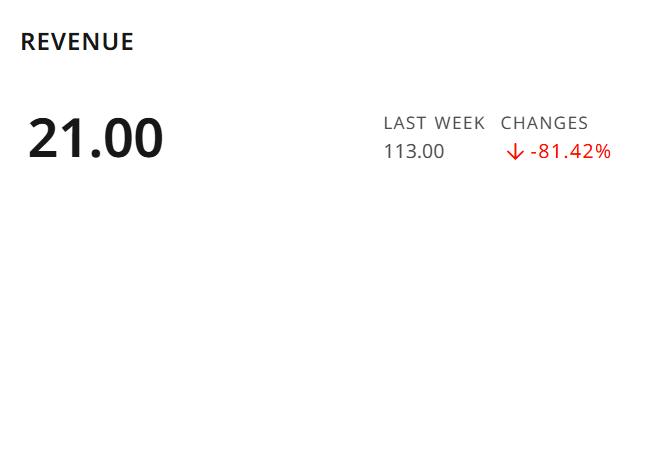
- Revenues: Displays the total sales during the specified time period, whether daily, weekly, or monthly.
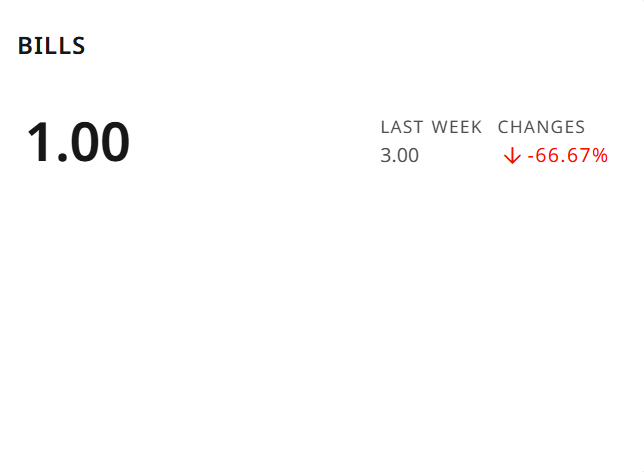
- Bills: Shows the number of invoices issued during the specified period, helping you understand the volume of business activity in your store.
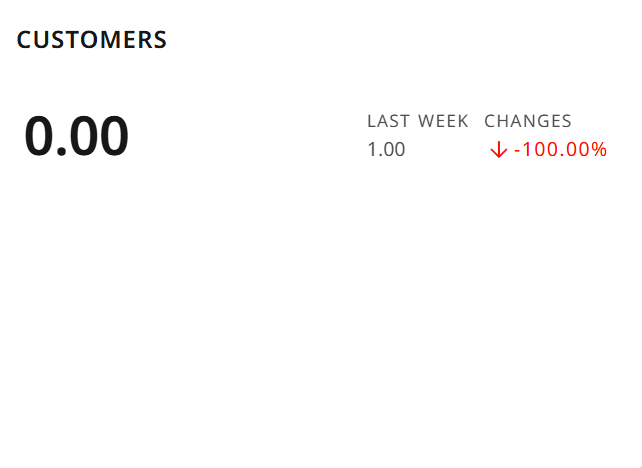
- Customers: Indicates the number of customers who made purchases during the specified time period, enabling you to assess customer retention rates and the acquisition of new customers.
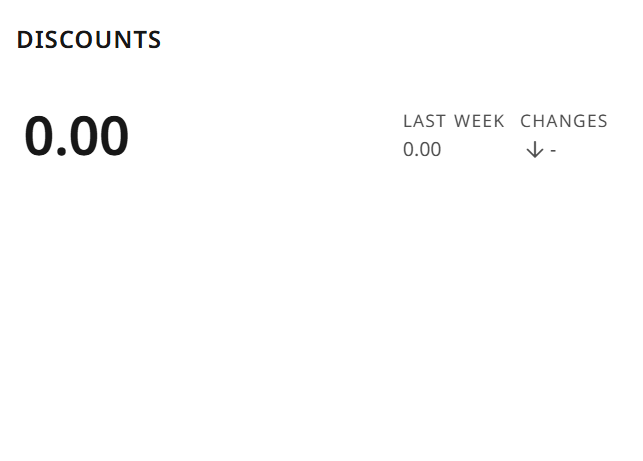
- Discounts: Displays the total value of discounts applied to invoices during the specified period, aiding in analyzing the impact of promotional offers on sales.
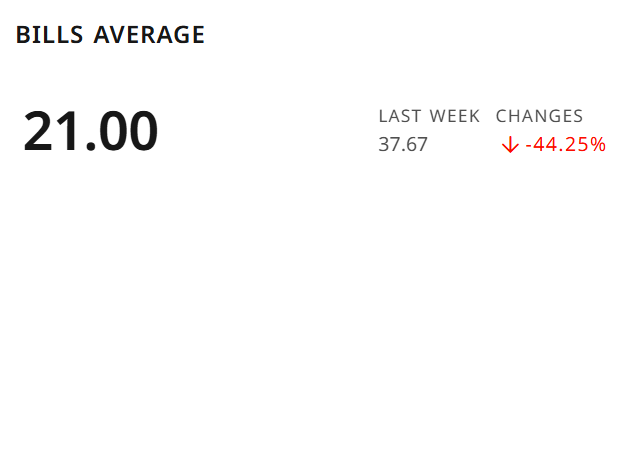
- Bills Average: Calculates the average value of issued invoices, providing insight into customer spending patterns in your store.
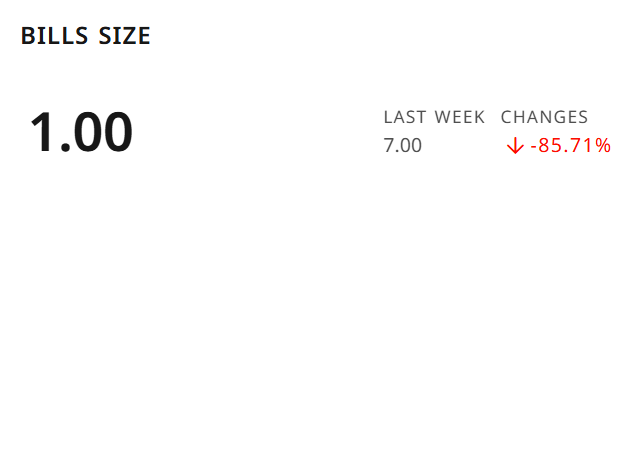
- Bills Size : Shows the average number of items purchased per invoice, assisting in analyzing customer behavior and identifying products frequently bought together.
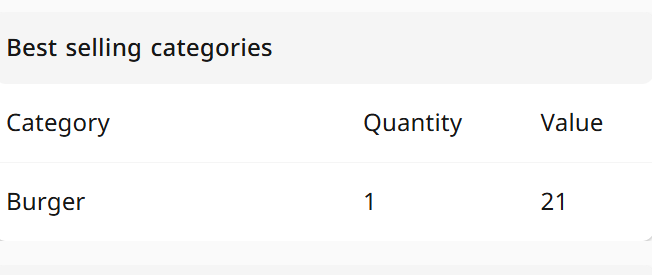
- Revenue by Category: Illustrates sales for each category offered in your store, helping you identify the most revenue-generating categories and make marketing decisions accordingly.
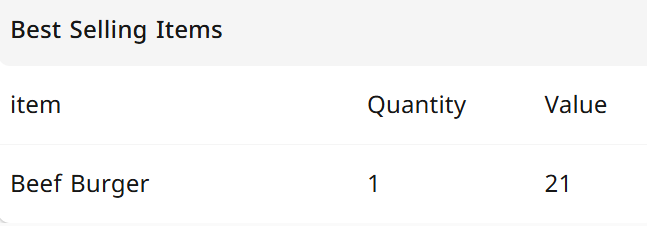
- Top-Selling Items: Displays a list of the most demanded items in your store, allowing you to plan your inventory based on customer preferences.
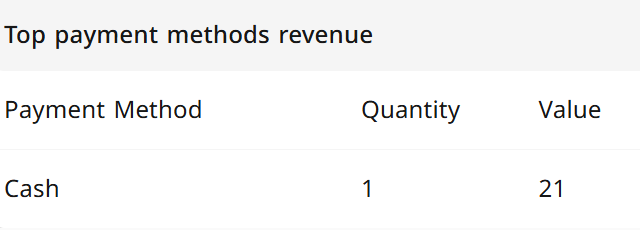
- Revenue by Payment Method: Shows the contribution of each payment method (such as cash, credit cards, e-wallets) to the total revenue, helping you understand customer preferences regarding payment methods.
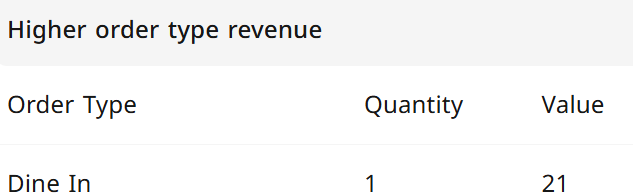
- Revenue by Type: Displays revenue according to specific types of products or services, providing a detailed view of the performance of different product categories.
Frequently Asked Questions:
+ Can I customize the data displayed on the dashboard?
Currently, the dashboard displays the main data, but you can filter the results by different time periods (daily, weekly, monthly) for more precision.
+ Why are some data not appearing on the dashboard?
This may be due to the absence of sales or updates during the specified period. Ensure you select a time period that contains active data.
+ How can I view data for a specific branch?
If you manage multiple branches, you can select the desired branch through the filter list (if this feature is available in your account).
+ Is the data updated automatically?
Yes, the data is updated automatically, but you can manually refresh the page to ensure the latest statistics are displayed.
+ Can I export data from the dashboard?
Currently, the dashboard does not support direct data export, but you can utilize the available reports in the system for more details.